As we prepare for the Fall Market, please see the monthly comments from our Economist. We hope you are all well and in good health.
– Maya Sewald, DRE #00993290 – Jason Sewald, DRE #01732384
Welcome to our August newsletter, where we’ll explore residential real estate trends in Silicon Valley and across the nation. This month, we examine the state of the U.S. economic recovery using Real Gross Domestic Product (GDP)1, the potential effects of the Delta variant on the housing market, and the ways in which the homebuyer profile changed over the last year.
In terms of GDP, which is the broadest measure of goods and services produced, our economic recovery stands at about 70% of where we would likely be if the pandemic had never happened. Unfortunately, the Delta variant has diminished the likelihood of the pandemic ending with any sort of speed and caused a return to mask mandates in many parts of the country. Although full lockdowns are unlikely, high case counts and a return to near-universal masks and social distancing will disrupt our economic recovery.
The uncertainty surrounding the Delta variant and its effects on the economy caused rates to fall. Participants in our financial markets know that the Federal Reserve will try to stabilize the U.S. financial markets in times of uncertainty. At this point, it’s a given. The further decline in interest rates reflects that. Mortgage rates are now extremely close to the all-time low. At the same time, however, prices have risen, and the profile of homebuyers has shifted. More homebuyers are investors and full-cash buyers. With low-rate financing and a high number of qualified buyers, the rising prices haven’t reduced the demand for homes as one might expect.
As we navigate this period of high buyer demand and low supply, we remain committed to providing you with the most current market information so you feel supported and informed in your buying and selling decisions. In this month’s newsletter, we cover the following:
Key Topics and Trends in August: Uncertainty around the Delta variant will keep rates extremely low, which will likely drive up the already-high demand for housing. The number of home sales is on pace to be the largest since 2006.
August Housing Market Updates for Silicon Valley: Single-family home and condo prices climb higher, while new inventory struggles to meet demand in the area.
1Real GDP is inflation-adjusted GDP. All references to GDP use Real GDP figures.
Key Topics and Trends in August
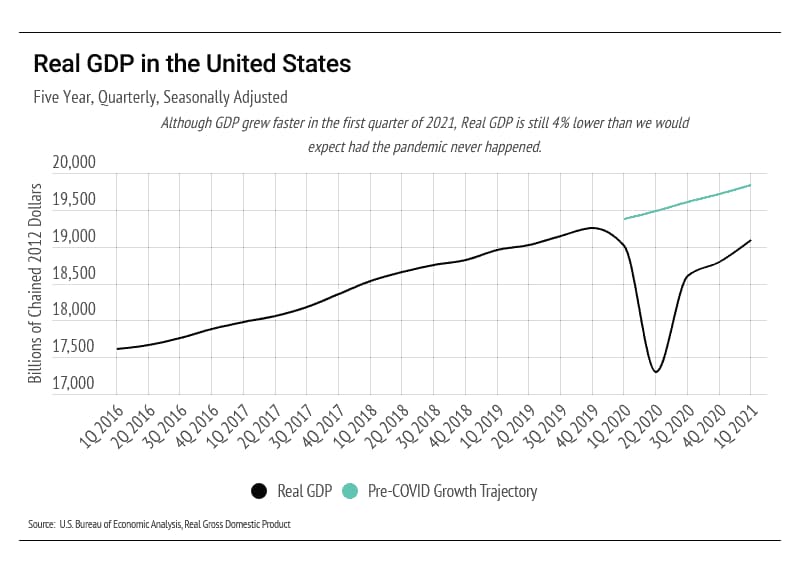
We’re about a year past the initial economic devastation caused by the pandemic. The second quarter of 2020 saw the largest single-quarter drop in GDP in history (-9%). GDP and employment together reveal much about the economic climate and typically trend with housing prices, but they do not explain the current rise in home prices. We’ll still discuss GDP and employment, however, because they are useful longer-term indicators.
The U.S. Bureau of Economic Analysis reported a 1.6% quarter-over-quarter gain to GDP in 1st Quarter (1Q) 2021, which is about 1% higher than the long-term quarterly growth rate of 0.6%. We need to outpace the long-term growth rate to get back to pre-pandemic levels. If it weren’t for the Delta variant, we might actually get there. The substantial infusion of cash into the economy has boosted GDP, but we’re still only at 70% of pre-pandemic levels. At the same time, there are about 10 million fewer jobs due to the pandemic. As the Delta variant runs through the country, our recovery will likely stall and the loss in GDP could be permanent.
The chart below illustrates the cost of a recession. While it depicts U.S. GDP from 2016 to 1Q 2021, it also illustrates economic patterns that occur in all recessions. GDP tends to grow at a fairly consistent rate during economic expansions. The green line illustrates the expected GDP had the pandemic never happened. As that green line shows, we are 30% below where GDP was expected to be in 1Q 2021. In other words, we’re still underwater despite the impressive quarterly increases in GDP.
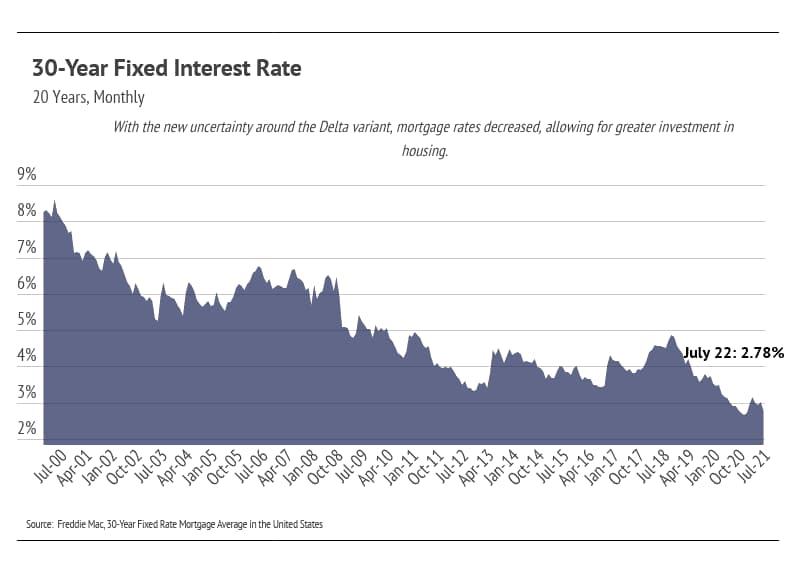
The fresh uncertainty surrounding the Delta variant caused rates to drop. The Federal Reserve is expected to support the financial markets by infusing money into them, which lowers rates and, in this instance, causes inflation to rise. As shown in the chart below, we are currently hovering at historically low mortgage rates, which will likely remain for the rest of the year. Low rates and inflation both incentivize buying. When consumers know that the dollar’s purchasing power is diminishing quickly, it makes more sense for them to buy a home sooner rather than later.
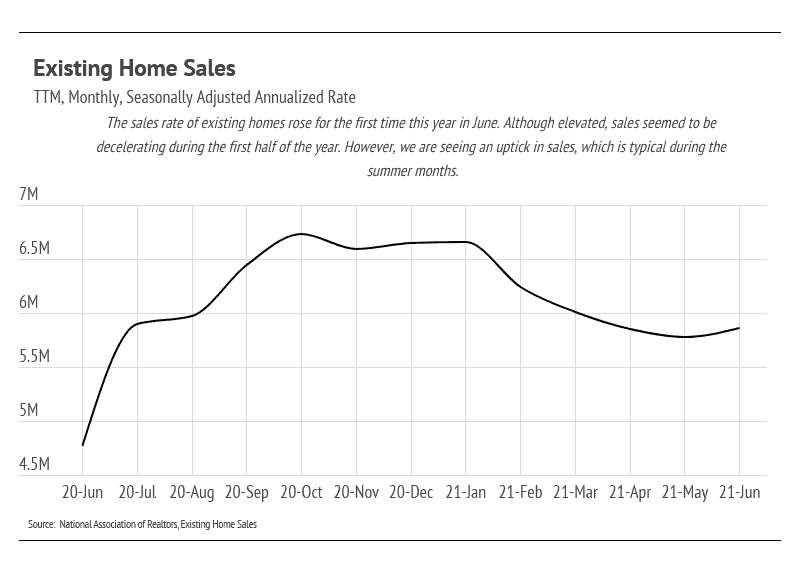
As we look at the last 12 months of annualized home sales in the chart below, we can see that sales rose significantly since last June. Although the rate of sales decelerated from January to May 2021, it rose again in June, which is a seasonal norm. More homes are coming to market and being bought quickly due to the excess demand. In 2020, incentives to purchase a home translated to the most homes sold in a year since 2006. Although we’re only halfway through 2021, it’s safe to say that home sales will outpace those in 2020.
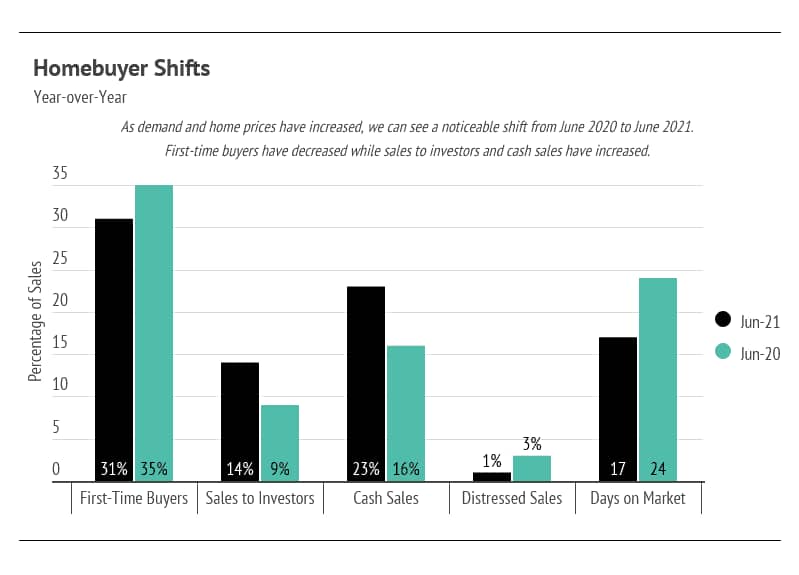
Demand for homes hasn’t diminished as prices soared over the last year. In a typical year, we would expect that a 20% increase in home value would price many potential homebuyers out of the market, thereby causing a price correction. In this instance, we’ve found that to be half true. First-time homebuyers are usually the first to get priced out of the market. Over the past year, we are seeing fewer first-time buyers coming into the market. However, even though there may be fewer buyers in one category, there are plenty of buyers in other categories to make up for them. In this case, we are seeing more investors coming into the market. Cash sales have jumped considerably, and homes are selling extremely quickly. As a result, it looks like prices will climb higher in the near future.
While the market remains competitive for buyers, conditions are making it an exceptional time for homeowners to sell. Low inventory means sellers will receive multiple offers with fewer concessions. Because sellers are often selling one home and buying another, it’s essential that sellers work with the right agent to ensure the transition goes smoothly.
August Housing Market Updates for Silicon Valley
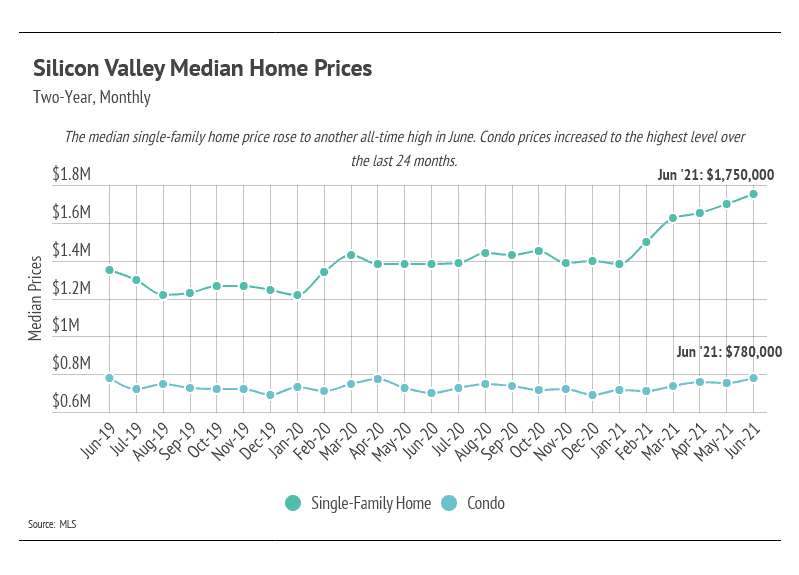
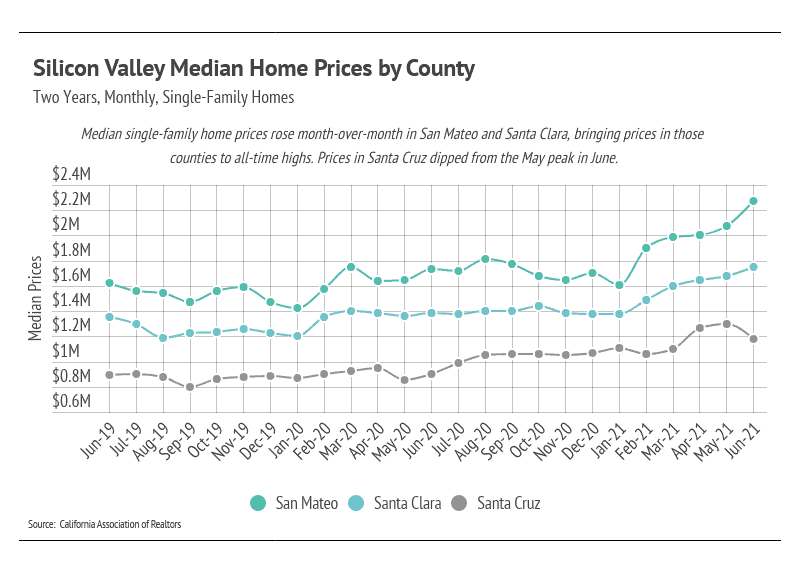
During June 2021, in Silicon Valley, the median single-family home price rose to a new all-time high. Condo prices rose month-over-month to the highest level in the last 24 months. By county, San Mateo and Santa Clara both rose month-over-month, while Santa Cruz prices fell from the May peak.
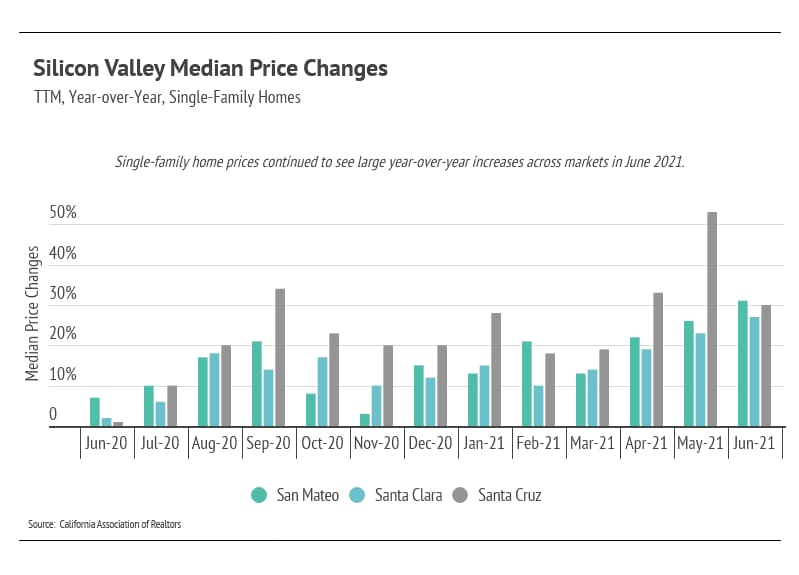
Year-over-year, single-family home prices rose significantly in Silicon Valley.
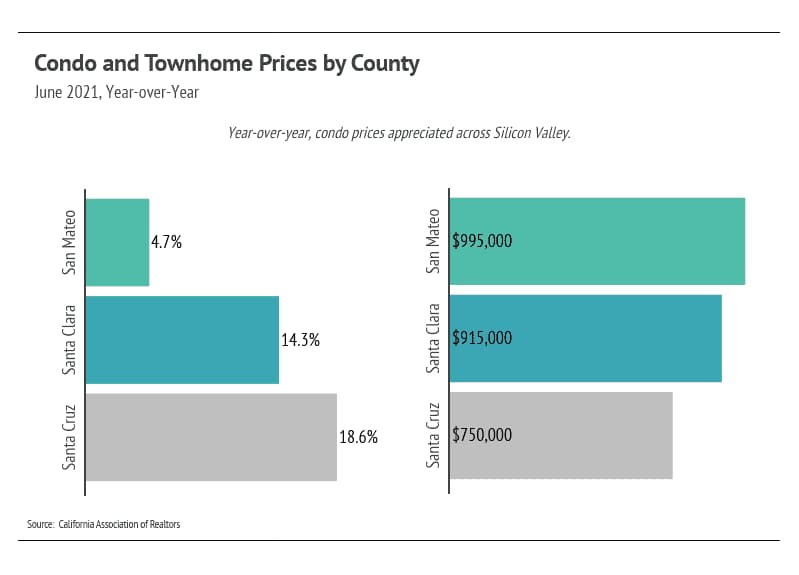
As you can see in the graph below, median condo prices increased across counties. Unlike single-family homes, Santa Cruz condos had the largest year-over-year percentage price increase.
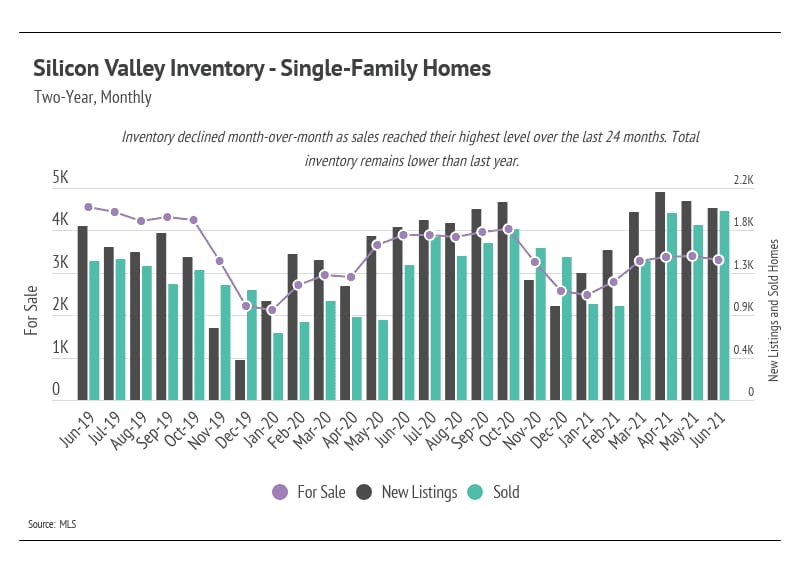
Single-family home inventory began to climb at the start of 2021 in anticipation of the spring season, when more sellers typically come to market, but has begun to decline once again. To gain a full picture of the current market, we must view it in the context of last year. In 2020, fewer people wanted to leave Silicon Valley, while more people wanted to move to the area. This trend drove inventory down to record low levels. New listings, therefore, improve the current market conditions. However, new listings aren’t keeping up with demand. In June 2021, Silicon Valley had 15% fewer homes for sale than it did in June 2020. Furthermore, when we compare the current inventory to June 2019 (pre-pandemic) levels, the number of homes for sale has declined by 27%. The sustained low inventory will likely cause prices to appreciate throughout 2021.
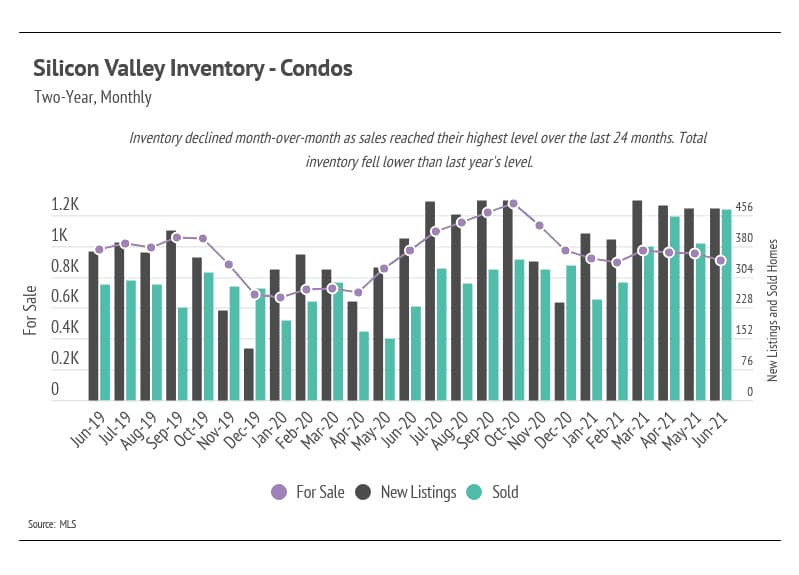
The number of condos on the market declined in June 2021, dropping inventory lower than last year’s levels. Although we’ve seen more condos than usual come to market over the last three months, condo sales reached their highest level over the last 24 months in Silicon Valley in June.
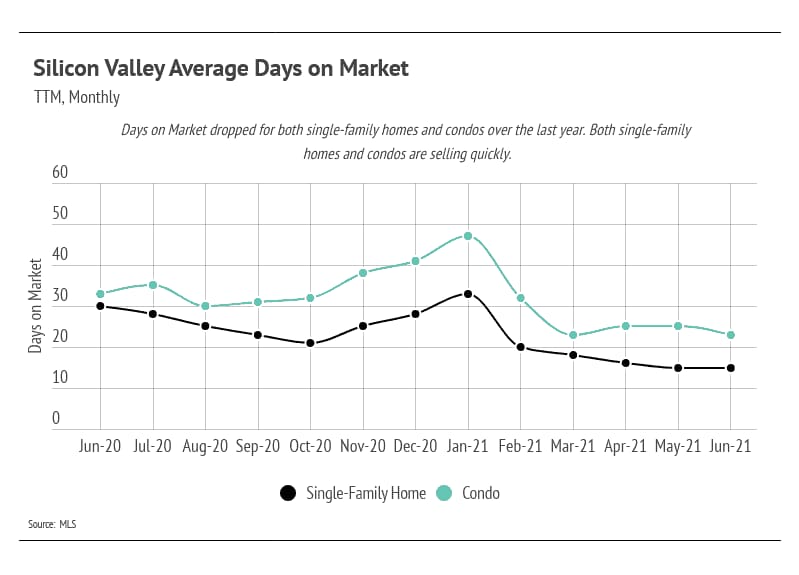
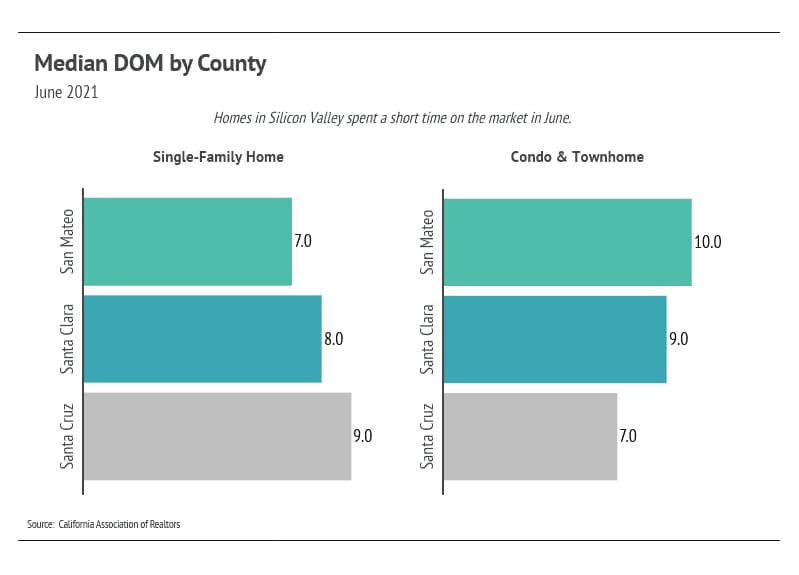
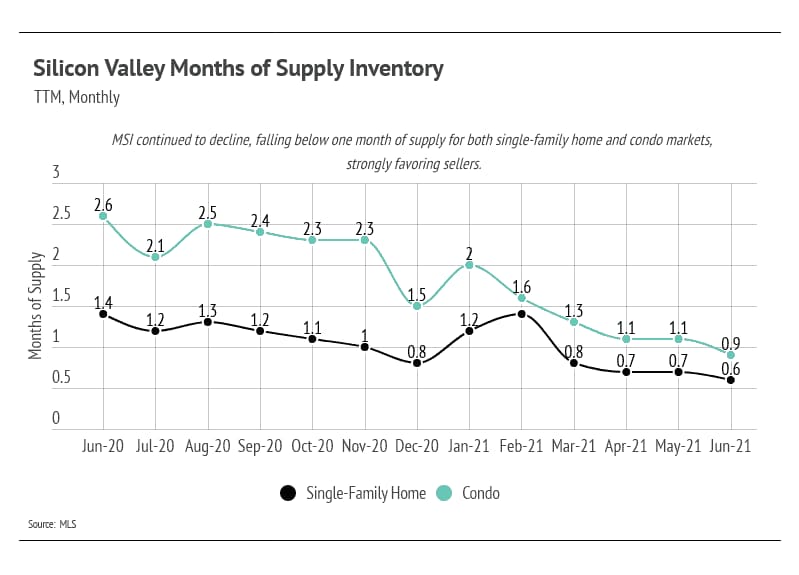
Both single-family homes and condos spent less time on the market in June 2021 than they did in June of last year. As we’ll see, the pace of sales has contributed to the low Months of Supply Inventory (MSI) over the past several months.
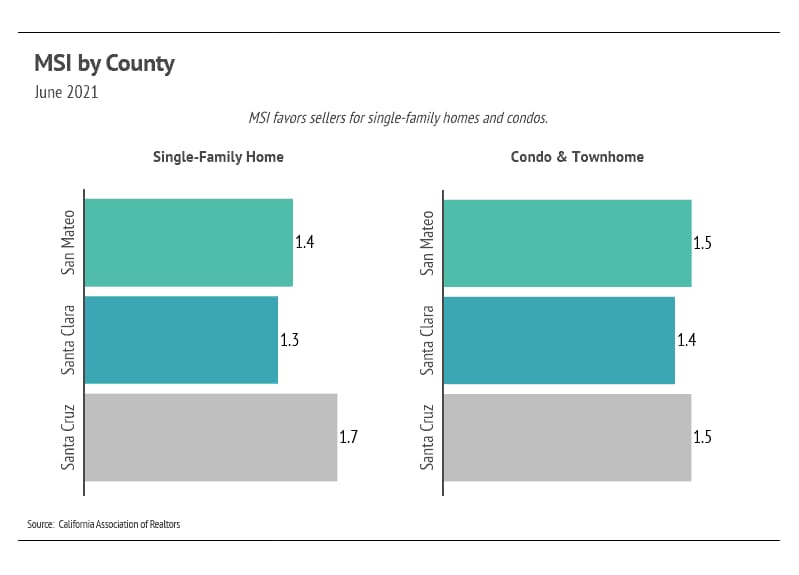
We can use MSI as a metric to judge whether the market favors buyers or sellers. The average MSI is three months in California, which indicates a balanced market. An MSI lower than three means that there are more buyers than sellers on the market (meaning it’s a sellers’ market), while a higher MSI means there are more sellers than buyers (meaning it’s a buyers’ market). In June 2021, the MSI fell below one month of supply for single-family homes and condos, indicating that the market strongly favors sellers.
In summary, the high demand and low supply present in Silicon Valley have driven home prices up. Inventory will likely remain low this year with the sustained high demand in the area. Overall, the housing market has shown its value through the pandemic and remains one of the most valuable asset classes. The data show that housing has remained consistently strong throughout this period.
We expect that the number of new listings will increase in the summer months. The current market conditions, however, can withstand a high number of new listings coming to market, and more sellers may also enter the market to capitalize on the high buyer demand. As we navigate the summer season, we expect the high demand to continue, and new houses on the market to be sold quickly.
As always, we remain committed to helping our clients achieve their current and future real estate goals. Our team of experienced professionals are happy to discuss the information we have shared in this newsletter. We welcome you to contact us with any questions about the current market or to request an evaluation of your home or condo.